✓ Added to cart


Statistics and Data | 8 Lessons, 8 Investigations & Box Plots | Grade 6
Statistics and Data | 8 Lessons, 8 Investigations & Box Plots | Grade 6
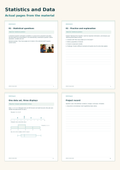
Statistics and Data is a Grade 6 math unit with 41 pages of classroom material and a separate 21-page teacher guide. It covers statistical questions, dot plots, histograms, box plots, and the mean, median and mean absolute deviation (MAD). It is written for middle school math teachers who want a self-contained statistics unit with explanations, worked examples, supported practice and reasoning cases. Students explain what the data shows and support it with evidence.
The unit has eight lessons, and each one uses the same three pages: an explanation page, a practice page with explanation, and a case card where students interpret a result instead of only calculating it. It starts with statistical questions and data and frequency, then moves through dot plots and histograms. The middle lessons cover mean and median and spread with MAD, and the later ones add box plots and quartiles. The last lesson asks students to compare data sets and communicate what they find. One page shows a single data set in three displays, and eight data investigations ask students to compute and explain center and spread. Two vocabulary pages, a learning check, a short project with a record page and a reflection page complete the unit.
What's Included
- Classroom Material: 41 pages (PDF, print edition)
- Teacher Guide: 21 pages (PDF) with answers, case guidance and assessment feedback
- One page showing a single data set in three displays, and eight data investigations with their own keys
- Editable DOCX text editions of the classroom material and the teacher guide
- Presentation with 17 slides (PPTX)
- Original illustrations; the PDF is the print reference and DOCX line breaks may differ
The 8 Lessons
- Lesson 1: Statistical questions – Students tell a statistical question from one with a single answer.
- Lesson 2: Data and frequency – Learners organize data and count how often values occur.
- Lesson 3: Dot plots – Students build and read dot plots.
- Lesson 4: Histograms – Learners group data into intervals and read histograms.
- Lesson 5: Mean and median – Students compute the center of a data set two ways and compare them.
- Lesson 6: Spread and MAD – Learners describe how spread out data is, including with MAD.
- Lesson 7: Box plots and quartiles – Students use quartiles to build and read box plots.
- Lesson 8: Compare and communicate – Learners compare data sets and explain the comparison in words.
Students Will Learn To
- Write and recognize statistical questions
- Organize data in tables and display it in dot plots and histograms
- Calculate and compare the mean and the median
- Describe spread with MAD and quartiles and read box plots
- Compare data sets and explain what the data shows
Perfect For
- Grade 6 math teachers who need a closed unit on statistics and data distributions
- Teachers who want practice that is supported first and reasoning cases after it
- Intervention or enrichment groups that need one statistics topic in depth
- Homeschool families looking for printable lessons with a separate answer guide
- UK and Australia: roughly Year 7
Why Teachers Choose This Unit
- Every lesson follows the same explanation, practice and case card pattern, so students know what to expect
- Case cards ask students to interpret a result, which goes beyond computing
- Eight data investigations add extra tasks, each with its own key in the teacher guide
- One page shows the same data in three displays so students can compare representations
- The editable DOCX text editions let you adjust wording for your class
Every resource is built around the curriculum you teach – and if something doesn't fit your standards, the TeachLessons Guarantee applies: we adapt it for you.
Created with AI assistance. Texts and illustrations were generated with AI support and edited for classroom use; sources and production notes are at the end of the teacher guide.
Frequently Asked Questions
Which standards does this fit?
The content is closest to CCSS 6.SP (statistics and probability), including statistical questions, data displays, and measures of center and variability. No alignment or endorsement is claimed.
Are answers included?
Yes. The separate 21-page teacher guide has answers and teaching notes for all eight lessons, keys for the eight data investigations, an assessment key with feedback, and a chapter on differentiation and observation.
How long does the unit take?
The material does not state a duration. Plan by lesson: each has three pages, and you can use all eight lessons in order or choose only some.
Does the unit include box plots and MAD?
Yes. Lesson 6 covers spread and MAD, and lesson 7 covers box plots and quartiles. Dot plots and histograms are covered in lessons 3 and 4.
$24.99 – buy now
PDF · instant download
🔒 Secure checkout · ♾️ reuse every yearFAQ about this resource
More Math resources for Middle School



Review: Statistics and Data | 8 Lessons, 8 Investigations & Box Plots | Gra...
Statistics and Data | 8 Lessons, 8 Investigations & Box Plots | Grade 6 is a fully worked-out teaching resource for Math at Middle School level (Grades 6). Its strength is that it is finished: worksheets, answer keys and teacher notes are all there, so a lesson can start without extra prep.
Teachers covering a topic at short notice, early-career teachers under planning pressure, and anyone picking up a cover lesson — and any situation where a lesson has to be ready today.
An editorial assessment of structure, scope and classroom use. It is not a customer review.